> For the complete documentation index, see [llms.txt](https://docs.cherryai.com.cn/llms.txt). Markdown versions of documentation pages are available by appending `.md` to page URLs; this page is available as [Markdown](https://docs.cherryai.com.cn/docs/en-us/pre-basic/settings/usage.md).
# Usage Statistics
Usage statistics turn your Cherry Studio **model usage into a visual dashboard**: At a glance, you can see how much money was spent, how many tokens were used, how many requests were made, and which model was used the most. It helps you estimate costs, spot abnormal usage, and compare the trade-offs of different models.
After opening `Settings → Usage Statistics`. The page is divided into **Overview / Explore / Requests** three sections, which can be switched in the upper right corner **Last 30 days / Last 90 days / Last year**, and all data is aggregated for the selected period.
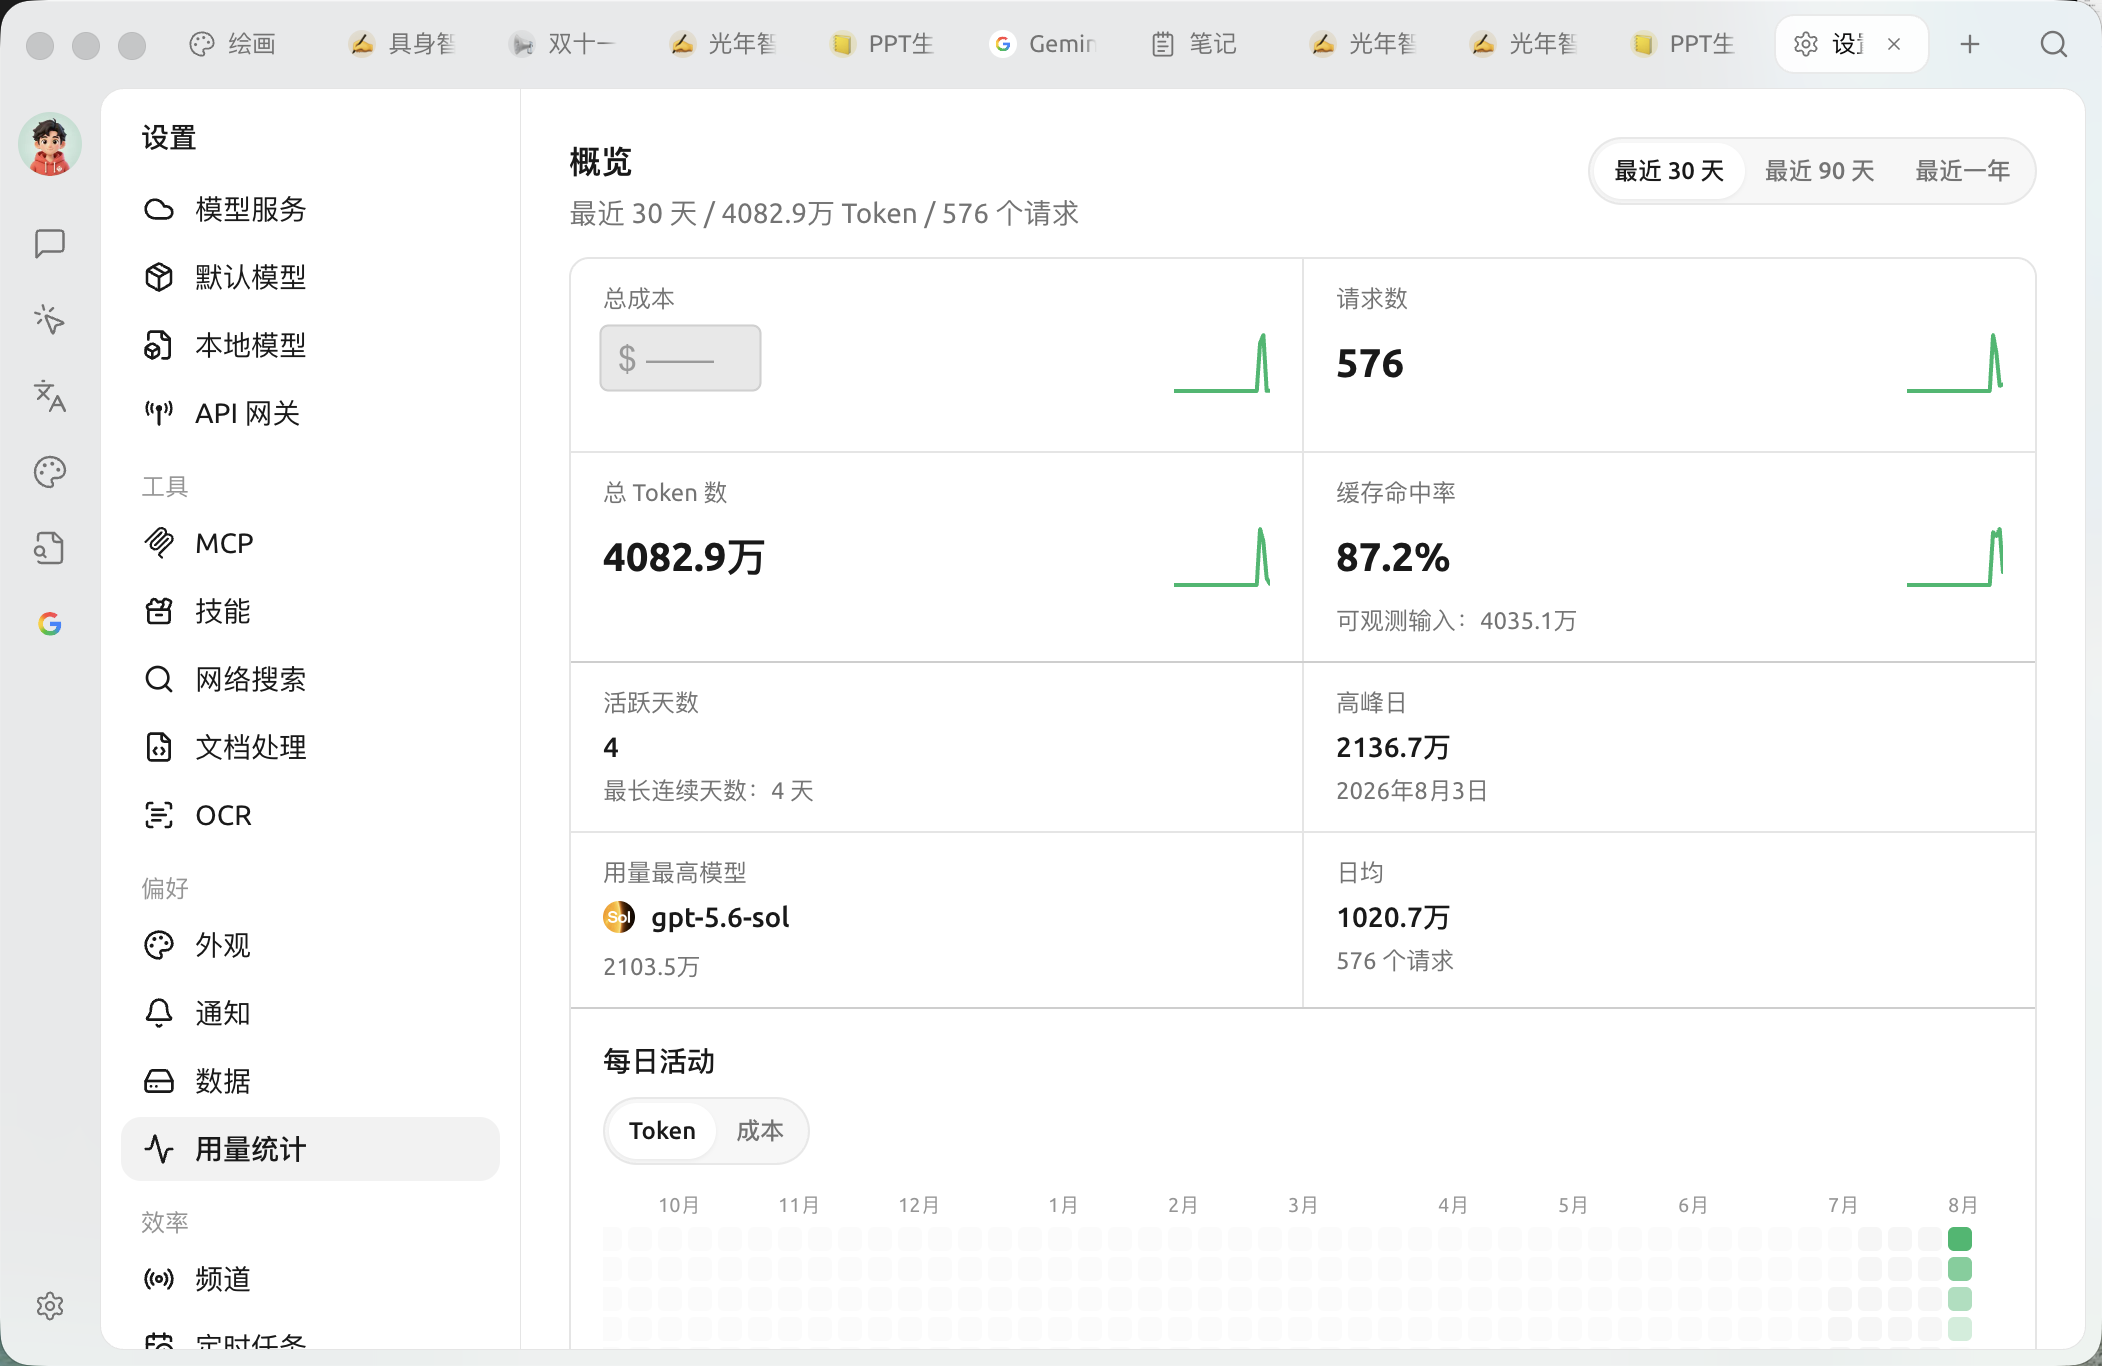
Usage Statistics [Overview]: top metric cards + daily activity heatmap below (total cost hidden in the image)
### Overview
A set of metric cards at the top:
| Metric | Meaning |
| -------------------------------------------- | ------------------------------------------------------------------------------------------------------------ |
| **Total Cost** | Estimated spending in the selected period (calculated using each model's public pricing, for reference only) |
| **Number of Requests** | Total number of requests initiated |
| **Total Tokens** | Total tokens for input + output |
| **Cache Hit Rate** | Proportion of prompt cache hits (cache reads hit ÷ observable input); the higher, the more cost-effective |
| **Active days / Longest consecutive streak** | Number of days with usage records and the number of consecutive days of usage |
| **Peak Day** | The date with the highest single-day usage and its token count |
| **Highest-Usage Model** | The model that consumed the most in the selected period |
| **Daily Average** | Average daily token count and request count |
The **daily activity** heatmap shows usage intensity by day, and you can switch between **Tokens / Cost** the two dimensions; darker colors indicate more usage on that day.
### Explore / Analysis
Switch to **Explore** You can perform a breakdown analysis of usage: by **groups**(provider / model / API key / assistant·Agent), choose one **Metric**, then use **bar chart / line chart / pie chart / segmented** and other charts to view distribution and trends.
### Request Details
**Requests** Lists request records one by one, making it easy to identify which requests generated the main consumption.
> Want to view by a specific day? In the overview's **daily activity** heatmap, click a day, and the explore area (analysis + requests) will **drill down** to that day, and the title will change to "Specific Day Details"; click "Clear Date Filter" to go back.
{% hint style="info" %}
Cost is **an estimate**: it is converted according to the model's public pricing; actual billing is still based on each model provider's invoice. Free models and local models do not incur charges.
{% endhint %}
***
### Get help and submit feedback
If you encounter any questions, bugs, or have suggestions for feature improvements during configuration or use, please refer to [Feedback and Suggestions](/docs/en-us/question-contact/suggestions.md) for the official channels provided.
---
# Agent Instructions
This documentation is published with GitBook. GitBook is the documentation platform designed so that both humans and AI agents can read, navigate, and reason over technical content effectively. Learn more at gitbook.com.
## Querying This Documentation
If you need additional information that is not directly available in this page, you can query the documentation by asking a question.
Perform an HTTP GET request on the following URL with the `ask` and `goal` query parameters:
```
GET https://docs.cherryai.com.cn/docs/en-us/pre-basic/settings/usage.md?ask=&goal=
```
`ask` is the immediate question: it should be specific, self-contained, and written in natural language.
`goal` is what the user is ultimately trying to achieve, the reason they need the answer. Sharing it helps GitBook give you a better, more relevant answer. A goal is most helpful when it describes the outcome the user wants rather than restating the question. For example, with `ask=how do I create an API token`, a goal like `automate deployments from our CI pipeline` lets GitBook tailor the answer to that use case.
The response will contain a direct answer to the question and relevant excerpts and sources from the documentation.
Use this mechanism when the answer is not explicitly present in the current page, you need clarification or additional context, or you want to retrieve related documentation sections.